With Bitcoin reaching an all-time high and altcoins showing signs of good performance in the coming year, now is the perfect time to get into crypto trading or double down on market signals if you already hold altcoins.
Keeping your hand on the pulse of the market may be a bit of a chore, though. The easiest solution is to check the latest rates on your platform of choice. But what do you do if you trade across multiple platforms and hold dozens of altcoins?
You can build your own crypto portfolio spreadsheet tracker in Google Sheets! It’s not nearly as hard as it may sound at first. There are several options for both non-coders and people with some coding experience, all of them fully customizable.
How to build cryptocurrency tracker for non-coders
If you don’t have coding skills, don’t worry. There is still a way for you to create your own custom cryptocurrency tracker — via Google Sheets add-ons. There are several add-ons that allow beginners in the world of cryptocurrency to create custom trackers like this. Here are the best ones:
- Cryptosheets — an all-in-one solution with hundreds of APIs
- CRYPTOFINANCE — another all-in-one add-on, but with fewer APIs available.
If you were to create your own cryptocurrency tracker with CRYPTOFINANCE, it would look something like this.
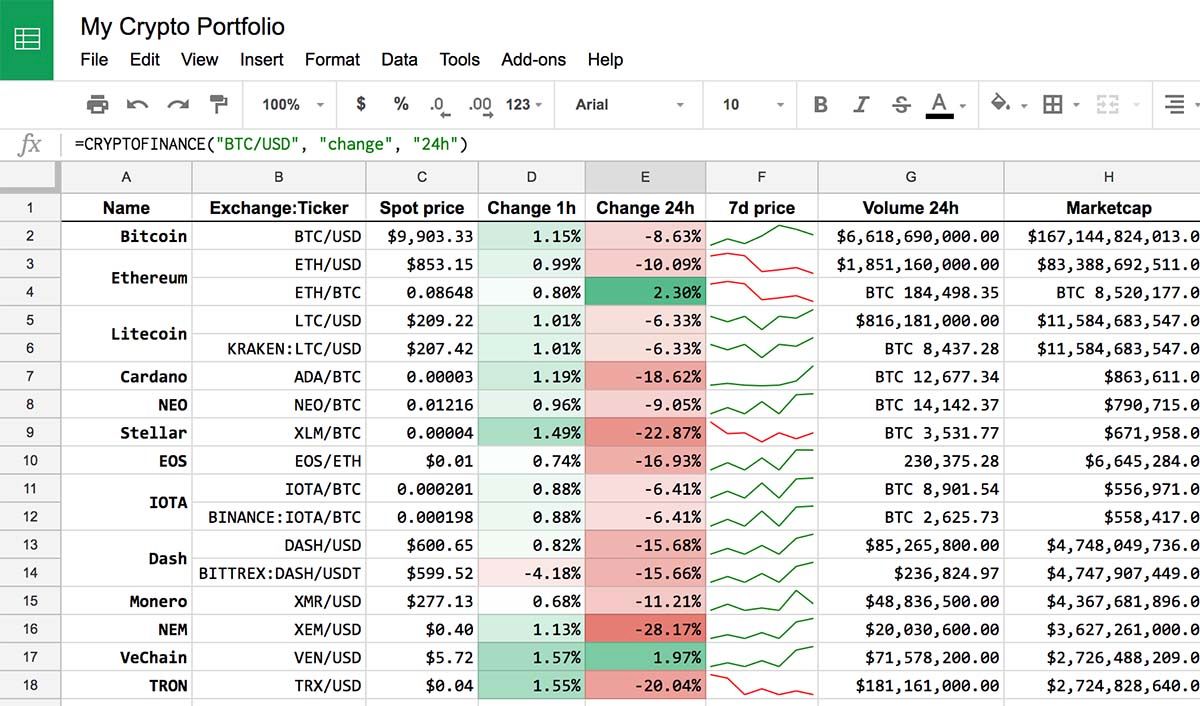
However, you’d have to fill in every cell with a variation of the custom formula, =CRYPTOFINANCE. With Cryptosheets, you can start much faster by getting a template. Here’s how that can look like.
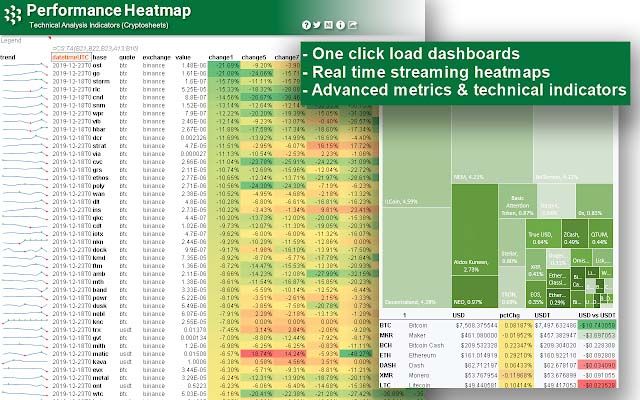
All you have to do is download the add-on, register an account, and connect an API or two.
Now, let’s look at how you can create a custom crypto tracker step by step. We’ll use the example of Cryptosheets as it’s probably the best spreadsheet for tracking cryptocurrency portfolios.
Get an account
Cryptosheets is an add-on, but one that operates on a SaaS model, so you will need to get an account to access its features. The free plan will get you quite a long way with 1000 monthly requests and all the important functions available.
The next tier is only $29 per month. Even though you’d have to pay $250 per month for more advanced features, it’s certainly cheaper than hiring a programmer to write all of that for you.
That said, if you don’t want to get into another SaaS subscription, you can do away with the free plan, or use CRYPTOFINANCE to pull the cryptocurrency data in a Google spreadsheet.
Import a template sheet
Here’s why Cryptosheets is such a good choice for beginners: it has almost a hundred templates. You can import one and use it right away without having to set up a custom spreadsheet.
For a complete beginner, it’s better to go with the Crypto Portfolio Fundamentals. You can easily update it further down the road as you learn the ropes.
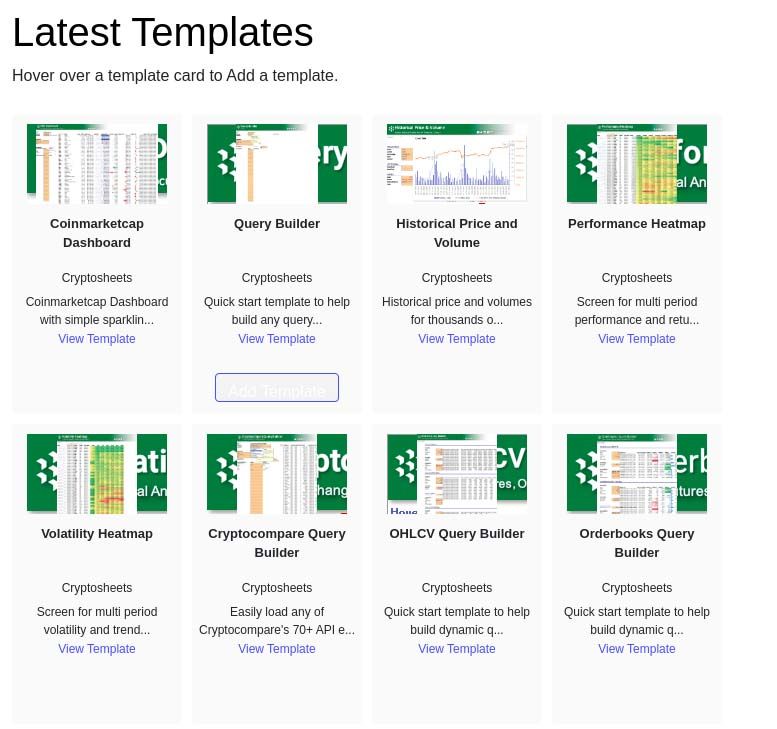
Once that is done, go to the sheet labeled “Help” and follow instructions to set it up. You’ll have to write the names of the API endpoints you’re going to access in dedicated cells of the sheet labeled “Query Builder.”
You can find those names on the Cryptosheets website by going to Workspace > API > Endpoint and looking for the ones you need.
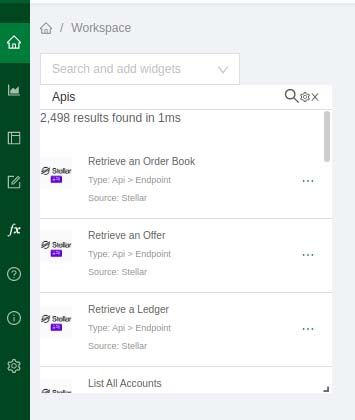
Once you type that in, the spreadsheet is ready to go. Put the refreshment rate in the dedicated cell as written in the instructions, and the custom query will update and pull the data you need to your new spreadsheet for cryptocurrency. It will also import JSON to Google Sheets, and perform all the necessary calculations.
That is a bit complicated to set up, but you do have the ability to customize the data you receive. If you want a simpler option, Cryptofinance is way easier to set up, albeit it doesn’t provide as much data.
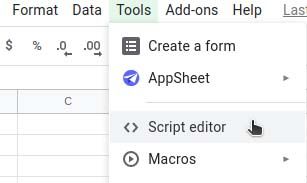
All you have to do is to create a new Google Sheet, go to Tools > Script Editor, and paste the source code there. The source code is available on the add-on’s website.
When you do that, you can use custom functions =CRYPTOFINANCE to create your own custom spreadsheet for tracking crypto.
Experiment with templates & customize
That’s it, if you’re done with the steps above, you’re already tracking crypto! Your next step is to learn the ropes and experiment with different templates.
To customize these templates and custom functions even further, you’ll have to know a bit about programming.
How to create a cryptocurrency spreadsheet for coders and power users
To get the most out of your custom cryptocurrency portfolio tracker, you need to write it yourself. If you have some experience in JavaScript, this shouldn’t prove hard by any stretch of the imagination. Here is a step by step guide on how to do it.
Take inspiration from open source projects
The first step on this journey is checking out the open-source projects to see how they work and what APIs do they need to function. Feel free to experiment with these four cryptocurrency trackers. Import the code to the Google Sheet you’re using and test them.
That said, there are some crucial points to learn first. The earlier version of Google Apps Script, Rhino, has some incompatibilities with the latest version of JS. The new GAS version, V8, has none of those problems. Keep that in mind, since some of the open-source code is written in Rhino runtime.
You should also keep in mind that API requests in Google Sheets are capped at 20,000 daily.
Request access to the APIs you need
The next step is to get access to the APIs you need. What exact APIs you need is entirely up to you. You can go with one popular API like CoinGecko or Binance API to track cryptocurrency rates in your spreadsheet, or request dozens of APIs to track rates across different exchanges.
To get a glimpse of your portfolio, you can use the trading platform API. If you have holdings across multiple altcoins and exchanges, use a blockchain explorer API like CryptoID.
Build and test your custom tracker
With that out of the way, it’s time for you to start coding. With the examples of open-source cryptocurrency trackers in Google Sheets and your knowledge of JavaScript, this should prove an easy task.
Visualize the data
Parsing JSON is great for a machine, but not for a human. The best way you can understand all that data you’ve compiled is through a chart, so the next step towards building a custom cryptocurrency tracker is by creating data visualization tools.
![]()
These are easy to set up and do not require coding skills. You can also set them up in another sheet meant for data visualization only, or create a spreadsheet for tracking cryptocurrency profits, for tracking a portfolio, and exchange rates as separate sheets.
Set triggers for the code
Once your code is up and running, all you need to do is set time triggers. Go to the script document and click on “Current project’s triggers” to get into the dashboard. Then, create a new trigger.
![]()
This trigger will regulate how often the document updates and pulls new data into the cryptocurrency tracking spreadsheet. Don’t forget that Google Sheets are capped at 20,000 daily API requests.
Now that your project is ready to go, you can either get notifications via this trigger or complete the code with a custom notification system. Since Google Apps Script works with all Google services, you can easily save charts in PDF after the document is done updating and send them to your email.
Conclusion
Having your own cryptocurrency tracker in Google Sheets is a quick, easy, and free way to keep your hand on the pulse of the industry. Use one of these methods to create a custom spreadsheet, set up notifications, and enjoy your new tool!
Contributed by Zakhar Yung
Updated on 27th February 2024